
Real accounts. Real numbers. Receipts you can check.
We manage one objective per account at a time — scaling or efficiency — because chasing both at once weakens both. Here’s proof of each.
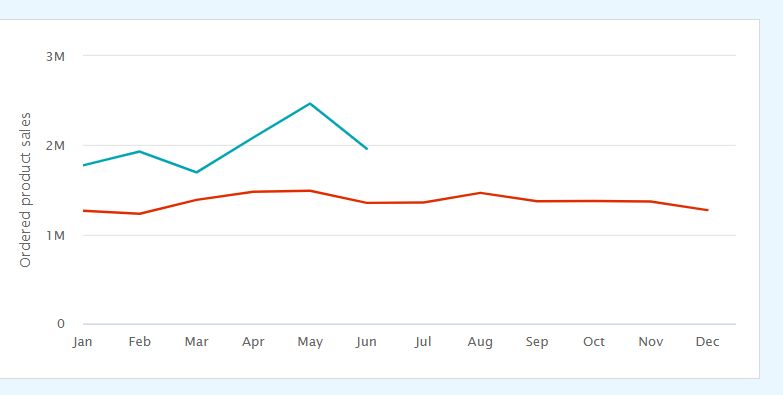
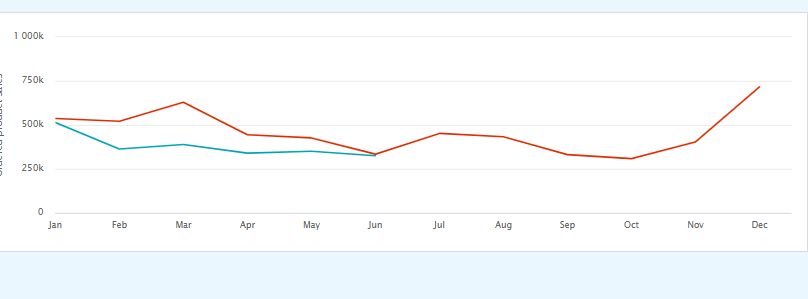
Same brand, one year apart. We took it to #1 on the keywords that actually sell.
The blue line is this year. The red line is last year. We didn’t buy that gap — we ranked our way into it.
Position one. And it stayed there.
A live rank tracker across 317 search terms. Green is the top of the page. On the keywords that move money, it’s green all the way down.
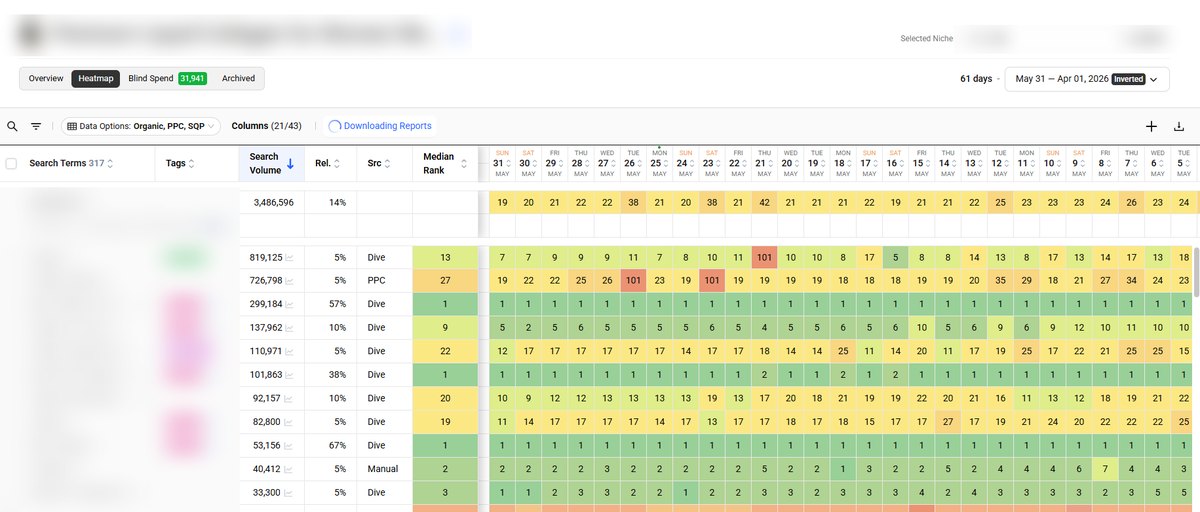
Rank isn’t luck. It’s a system.
Four moves, run in order, every week.
Find what’s worth owning
Data Dive told us which keywords had real volume, real intent, and a real opening the competition left wide open.
Take the rank
One keyword per campaign, exact match. No noise, no waste. Push the term up, then pin it there.
Watch it daily
Rank Radar tracked all 317 terms. We poured fuel on whatever climbed and cut whatever stalled.
Let organic pay you back
Once the rank stuck, free traffic took over. Cheaper sales, better margins, growth that doesn’t vanish when you pause ads.
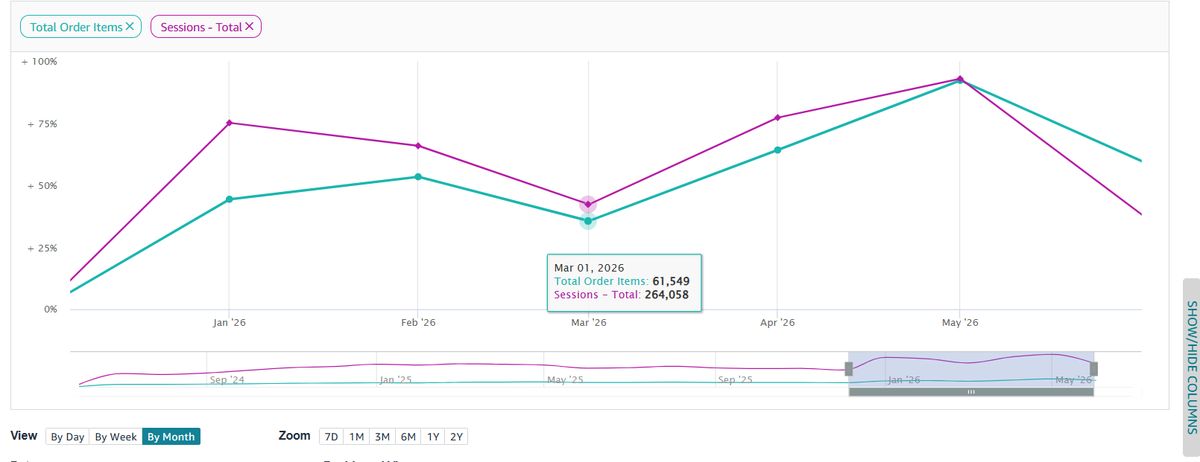
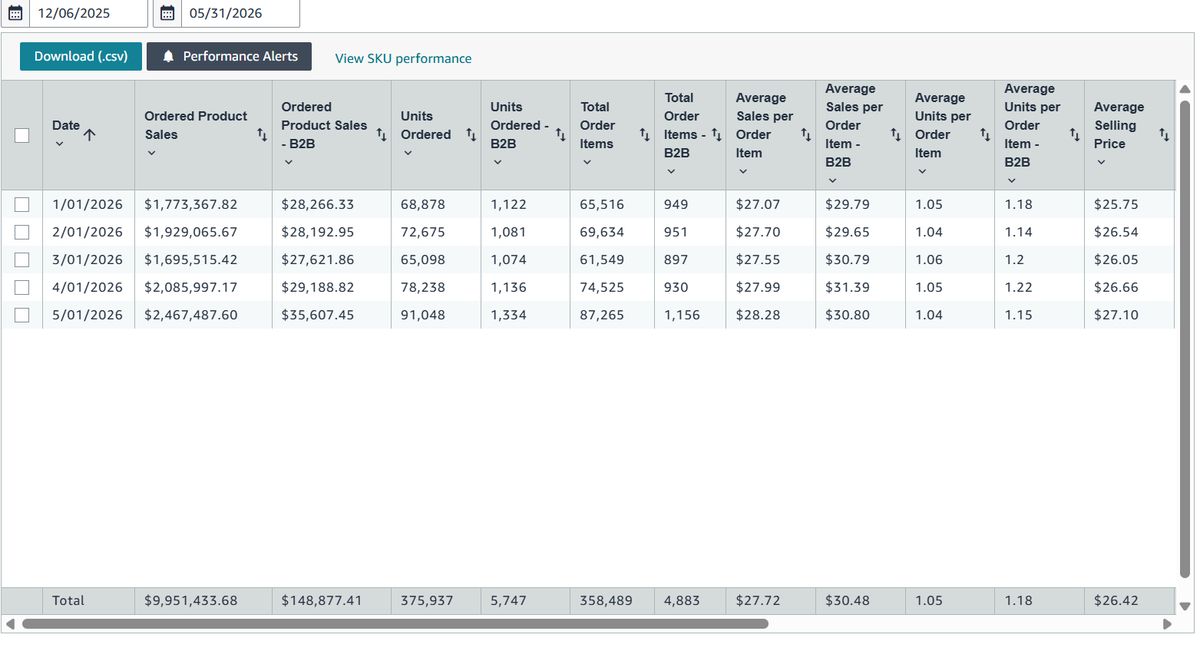
Orders up. Traffic up. Sales up.
Hold the top spots and the rest follows. Orders and sessions climbed together, month after month.
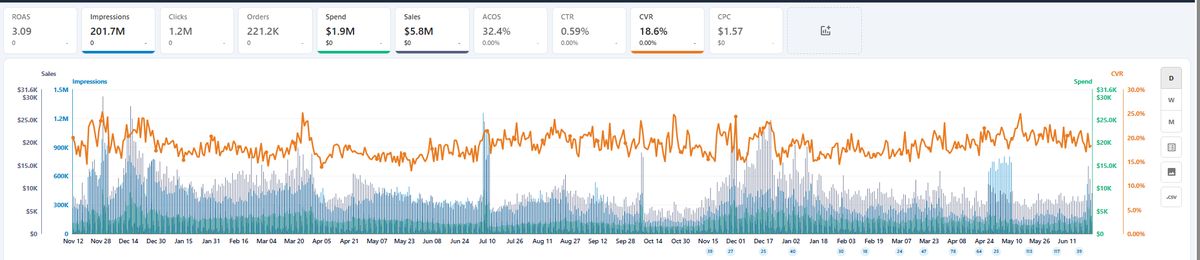
We rebuilt account health for a 7-figure brand — refunds down 37%, organic up 36%, on a sustained 3.09 ROAS.
Instead of buying growth, we made the account healthier: cleaner revenue, more organic share, less ad dependency, disciplined returns across $1.9M of managed spend.
A category leader in a softening market
This established brand was a leader in its niche, but category demand had cooled — sessions trended down roughly 35% year over year, pulling revenue with them. The account wasn’t broken; it was leaking efficiency and leaning too hard on paid traffic. So we set one objective: protect profitability and rebuild account health, not chase vanity top-line.
A profit-first cleanup, driven by audit
A full audit showed exactly where money was leaking. Then we cut it.
Restructure by intent
Brand defense, competitor conquest and high-intent targeting split into separate, controllable buckets.
Cut the waste
Negated non-converting search terms and paused high-ACoS targets bleeding budget for little return.
Spend where it converts
Reallocated budget to the placements and match types with the best return per click.
Grow the organic engine
Listing and conversion-path fixes so the brand earns more sales without paying for them.
More revenue from every visit
With traffic falling, we lifted the share of sessions that convert — the most important efficiency lever when demand is scarce. Equal six-month windows, year over year.
Account health, trending up
vs the prior 14-day period.
Scale, managed with discipline
Cumulative performance across the full management window.
Your account could be the next case study.
Tell us your product and your goal. We’ll audit the account, show you the opportunity, and map exactly how we’d get you there.
Get a Free Audit →Figures are drawn from each account’s own reporting over the windows shown (year-over-year monthly sales, a 61-day rank-tracker window, an 87-day performance window, and 14-day and managed-period snapshots). Results reflect each brand’s category, starting point, and market conditions and are not a guarantee of future performance. We focus on one objective per account — scaling or efficiency — because pursuing both at once compromises both. Your plan and targets are set during your audit.
 Amazon FBA Club